It might be safe to say that every data practitioner has heard about the star schema for data modeling, and perhaps even the snowflake schema. These approaches to data modeling "normalize" the database by reducing redundant data in each table, so that it lives separately.
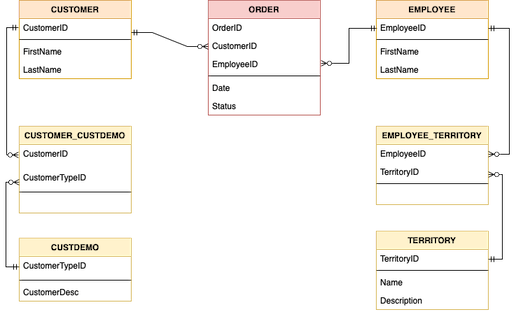
For example, here's a basic modeling approach for a commerce application where, say, an employee is in charge of the sales proccess. The fact table, orders, is noted in red, while dimension tables for the customer and employee are in orange, and further normalized data are noted in yellow.
Enter... the Data Vault
The data vault approach supercharges this model by allowing for historical tracking of records.
- Rather than fact tables with dimensions, we have hubs with satellites, each with a unique link. The satellites can be further normalized, and the links are used to keep track of their mutability.
- All records are stored, both good and bad, so that no information is lost.
- Transformations of the data are made on the way out of the vault rather than when it comes in. (Sound familiar?)
- And finally, hubs and satellites have a field for the loaded time stamp, as well as the source of the record.
There's certainly a lot more to chew on with this approach, which you can read about here. Below I've redesigned the previous model.
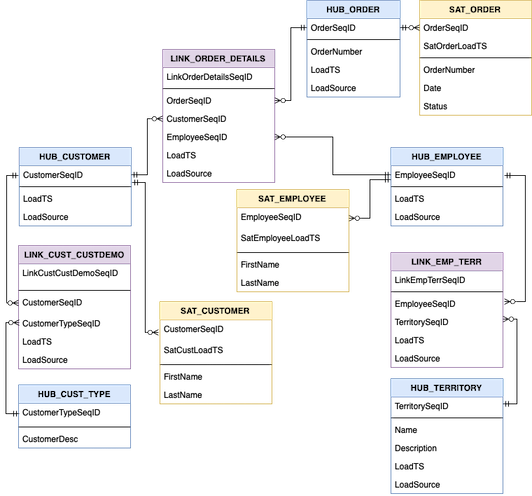
Wow that got complicated quickly! However, it's all in the name of accountability. Some things to note about the above diagram:
- Hubs refer to central business objects, and are noted in blue.
- Links are in purple; these are similar to other many-to-many relationship representatives, save that the use of the unique link sequence ID as well as load timestamp & source will account for changes in the linking relationship.
- Satellites are in yellow. These contain the normalized data for the hub entities, which may or may not change over time, thus, are unique per their hub sequence id as well as the satellite load time.
... It's saved my butt before!
Recently I was working on a project with a batch etl pipeline. One of our users raised a red flag to us that they were seeing unexpected behavior with one of the entities in our system, that could very well have been going on for a while.
Using some of the example units provided, our team was able to identify the individual records that were likely causing the issue, as well as their respective sources & when they entered the warehouse. It became clear quite quickly that there was a pattern in the type of sources that were causing the issue!
Increase your accountability
This approach is just one way to bring some much needed traceability to our modern data pipelines.