This semester I am in a class in which we aim to analyze a "large" dataset. There is one text variable in particular that we want to draw some insight from.
We had just been told how to access the dataset minutes ago, and something along the lines of the below goes down.
Professor: So how is it going? Any issues loading the data? Does anyone have any immediate insights?
Student 1: I made a word cloud of [variable of interest]... the most common words seem to be foo, bar, baz, etc.
Student 2: I made a word cloud of [other string column] and the most common words are foo2, bar2, baz2...
Professor: Great. continues lecture
Me, after class to the Prof: Have you already done some analysis on this dataset? Did you know [variable of interest] is 68% null?
Professor: Actually, no, I haven't looked at it yet. That's... certainly good to know. drops some more knowledge
Next class, she called on me to bring this up, and I swear you could have heard a pin drop. 🤦♀️
As with all of my classes, there are people in there much smarter than me - they know more models or more programming packages or more something. The students who spoke up initially already have real world experience in the field, but they forgot the first rule in the book... ABCD! Always Be Checking your Data.
Why? Because your data is almost never perfectly clean. I had a dataset come through where null values were coded as a string \N... yeeeaaaaah.... Good luck finding that! At its most critical, your checks can alert you that something is seriously wrong. At its most benign, this can generate questions for later and give you an idea of the amount of cleaning you will need to do or lead to new avenues of analysis!
Here are some of the things I do (to a 🐼 data frame) before I even begin:
- Call
.head()to peak at the first few rows. You can pass a number to investigate a larger amount of rows;.tail()also exists. - Check for nulls
- Maybe rename columns
- For continuous variables, look at the range and check for outliers
- Maybe adjust how your program displays numbers with digits, so it is more interpretable
- For categoricals, check the number of unique elements with
.nunique(). This can immediately alert you to issues with text - Make some quick histograms to check distributions
- If the dataset is large enough that memory may be an issue, make sure that the datatypes are appropriate for the content of each variable
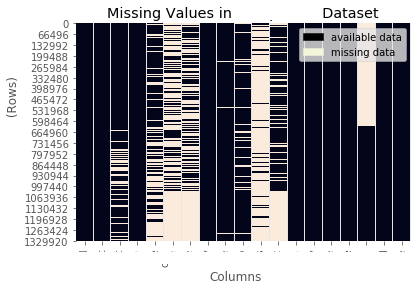
I'll close out with one way to visualize null values in a dataset .
While this may not be practical on a larger scale without parallelization, you can use seaborn to create a heat map of your entire data frame. In the below example, I've obscured some information about what's in there, but I will tell you that the observations are in chronological order. In the absense of meta data, I think this tells a lot about this dataset.
1 2 3 4 5 6 7 8 9 10 11 12 | |